

News / FAQ's
Sarbanes-Oxley
FAQ's
FASB
13 text
Interest
Rates
![]()
Documents
Tools & Papers
Sample
Kiometer™ Reports
![]()
Related Training
![]()
The point
of creating an effective family of measures is to allow the organization to
focus on what’s important!
![]()
Services
Pricing:
Key
Indicator development is dependent on staff interviews and reports
on business processes, it is hard to predict project cost without a discussion
of project scope and key objectives. After this conversation, we develop
a "Scope of Work" document that includes Project Objectives,
Project Deliverables, Timeline and Project Cost estimates. This
"scoping" work is done free of charge so that there is no risk to
our client.
Kiometer™ Reporting is priced by indicator or piece of equipment tracked with a monthly minimum charge for setup. We would be happy to discuss the details on a client-by-client basis since each client's situation is different.
No matter the activity, we stand behind our money back guarantee below. Please call for a quote.
Our Money
Back Guarantee:
"We
guarantee that we will locate savings opportunities in excess of our fees
or
THERE IS NO CHARGE."
(On
average,
we find 8 - 12 times our fees in savings. We are confident of finding
savings!)
![]()
As a technology-based
society, we have become very adept at collecting data — mountains of data,
but very little of it is USEFUL INFORMATION. We have discovered a way
to actually illuminate data so that you can “see” it in a way that leads to
meaningful decisions.
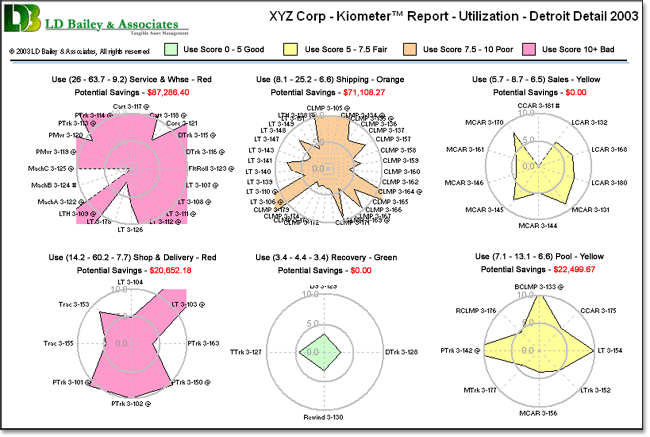
A typical Kiometer Report:

Kiometers™
are bull’s-eye graphs illustrating the supporting data and they have these
features:
4
Kiometers can be used on ANY key business indicator
or measure of success.
4
Kiometer Reports summarize ALL DATA, but
highlight ONLY the PROBLEM UNITS.
4
Complex data relationships are simplified by our
“TAILORING” (through analysis and programming) of your
data and environment.
4
Kiometer Reports can span MULTIPLE DATA SOURCES
to produce an integrated view of performance.
4
DISSIMILAR MEASUREMENTS can be illustrated on
the SAME Kiometer™. For example,
three assets
may have different optimal cost
targets ($3.54 per hour, $.72 per mile and $1.49 per case), but with Kiometer
scoring, all can be shown on the
same Kiometer.
4
Optimal scores (the 5 ring) are SET PROGRAMMATICALLY
so resetting the target to meet changing goals
is relatively easy.
4
Kiometer Reports can be published on our Web site
and made available by password control for
INSTANEOUS, PROTECTED
ACCESS.
![]()
Using Kiometers™
Kiometer™
Reports are packed with information, but are presented in a form that makes
it easy to identify the items that need attention. For example, the
Kiometer™
below summarizes the effective (or not) utilization of 8 pieces of material
handling equipmet - 2 lift trucks (LT), 3 trucks (Trk), and 3 pickup trucks
(PTrk). The performance scoring allows for disparate utilization scales
(miles for the trucks & hours for the lift trucks) to be shown on the
same graphic.
Also, the color, problem highlights, and Potential Savings allows the reader
to quickly determine 1) the general health of the location / department
/ entity (color), 2) how many problem units there are (@'s), and 3)
the size of the savings opportunity at that location / department / entity.
Look at the complete report above. Of the 81 pieces of equipment in
the six departments of XYZ Corp, which department and which units would you
concentrate on to gain maximum benefit of your fleet management efforts? Certainly
you would look at most of the units in the Service & Warehouse department
to capture $87,000 of cost reduction. Then, you would look at the 8
units in the Shipping department to save an additional $71,000. Sure
beats crawling through piles of green-bar reports and utilization logs.
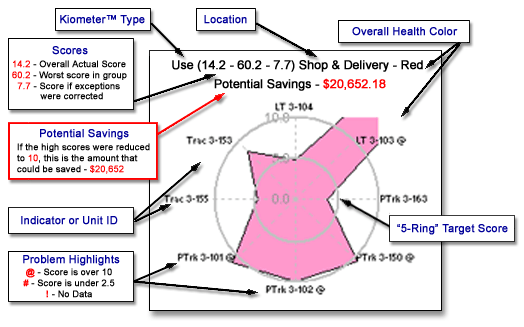
To get a better understanding of the parts of a Kiometer, see the diagram
below.
The Anatomy of a Kiometer™

To get
further information about how Kiometer Reporting can work for you,
please call or write... (Contact Us).
The Kiometer™
trademark is the property of LD Bailey & Associates. All rights reserved.
© 2005 LD Bailey
& Associates, Rev. 7-21-05